The
Performance Over Time report details your performance on all programs or particular programs over a set period of time. The information and graph generated are useful for identifying long-term trends in performance, as well as assessing the results of any short-term trials and promotions that have been run.
To run this report:
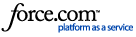
- Select the time period: You can either use one of the preset date ranges in the Period filter, or select Custom and set your own date range using the From and To filters below
- Select what data you want to see on the line graph by choosing a statistic in the Graph Showing filter. You can choose between Impressions, Clicks, Quantity, Amount, or Commissions
- Choose how you want the results to be grouped, either Daily, Monthly, or Yearly, from the Group Results filter
- Select the promotional region
- If you would like to see only the performance of a specific Advertiser, use the Advertiser filter to do so. If you do not change this filter, the stats will represent your total performance across all the advertisers you are promoting
- Click the Generate Report button to refresh the data
- Once the data refreshes, you will see a line graph reflecting the filters you set, with the Graph Showing field on the Y-axis and the Group Results field on the X-axis. Below, you will see the data grouped by either day, month, or year, depending on which one you selected. At the bottom of the page, are the grand totals of each column broken down by transactions status.
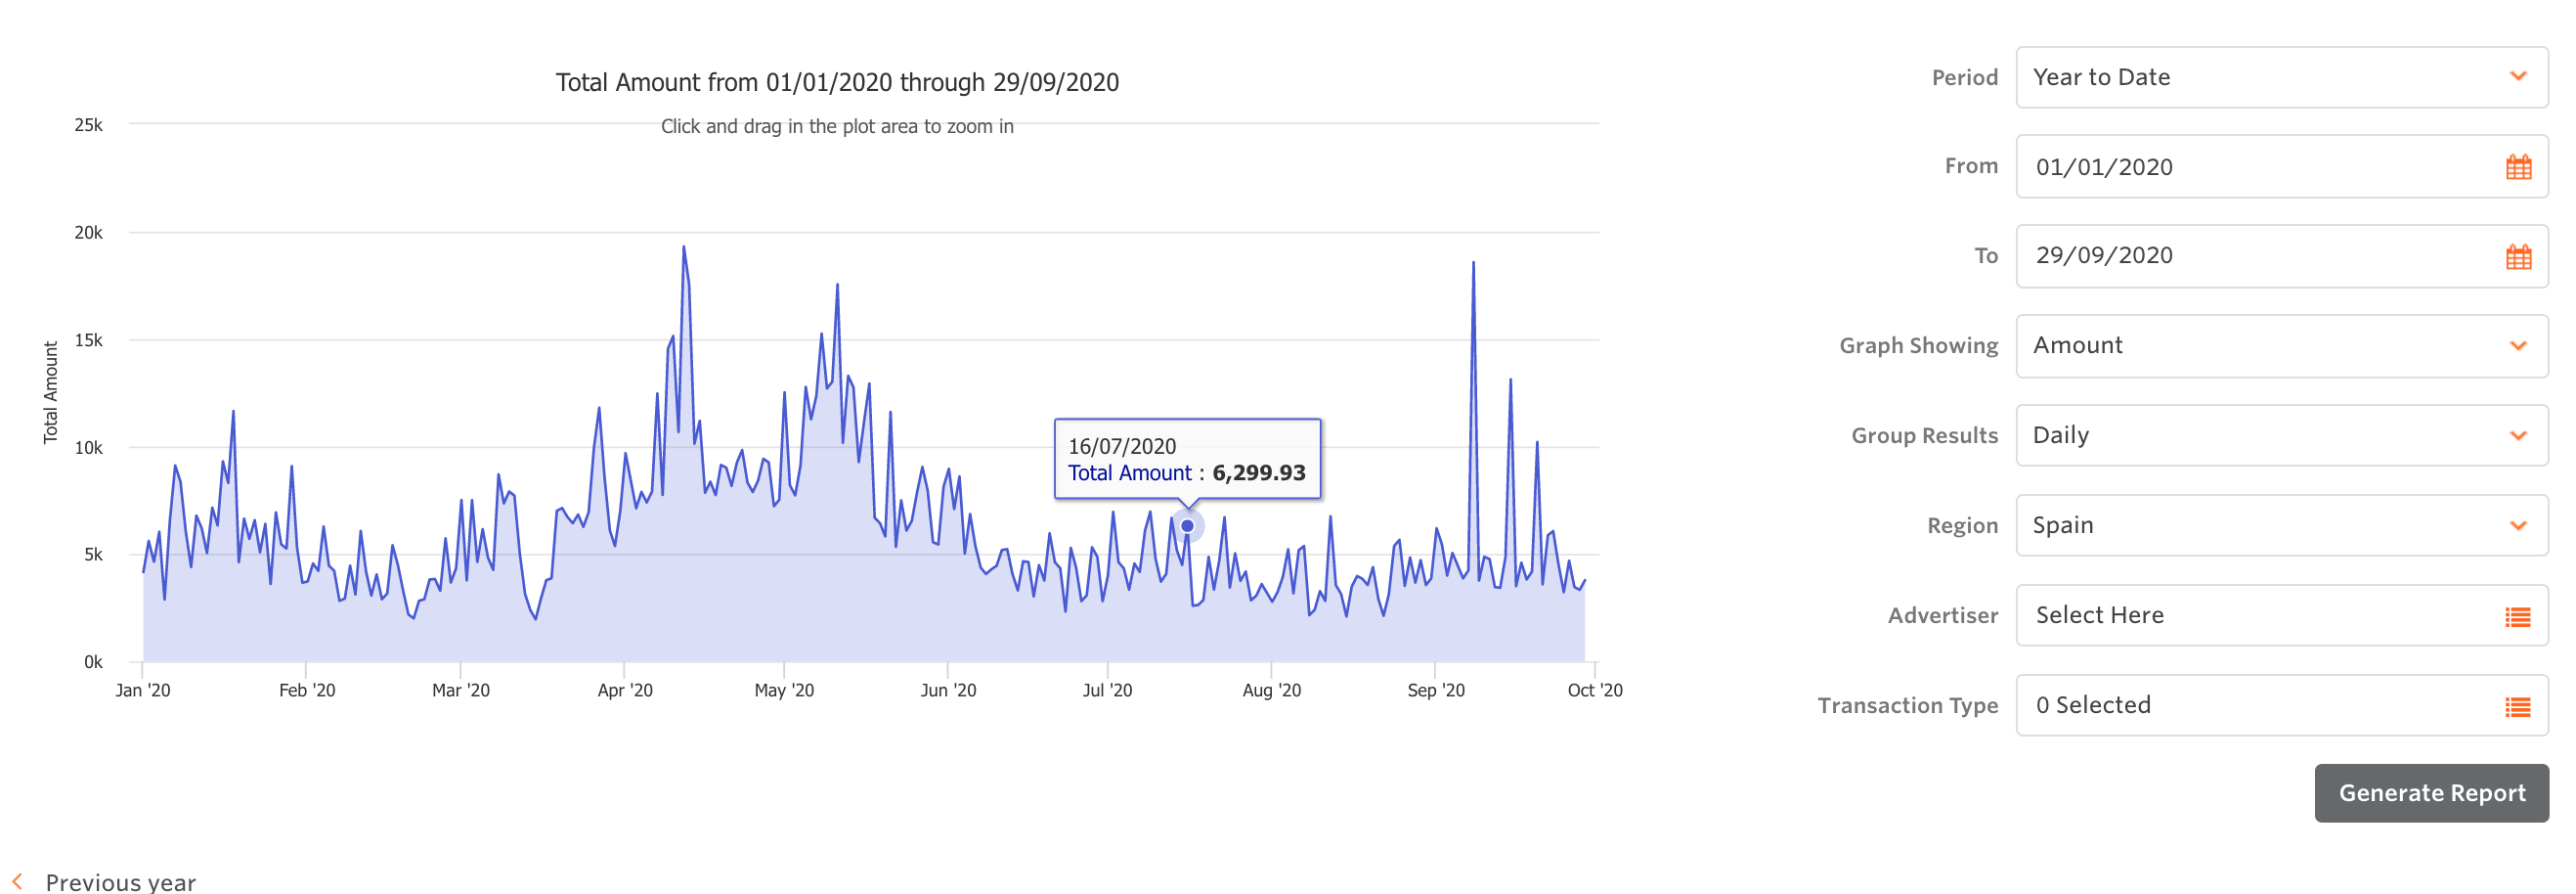
You also have the option to see the transaction status of each date group. To display this, click on Total at the top of the table and select the status you want to view, or click the arrow next to each date and see the full breakdown for that desired date group.
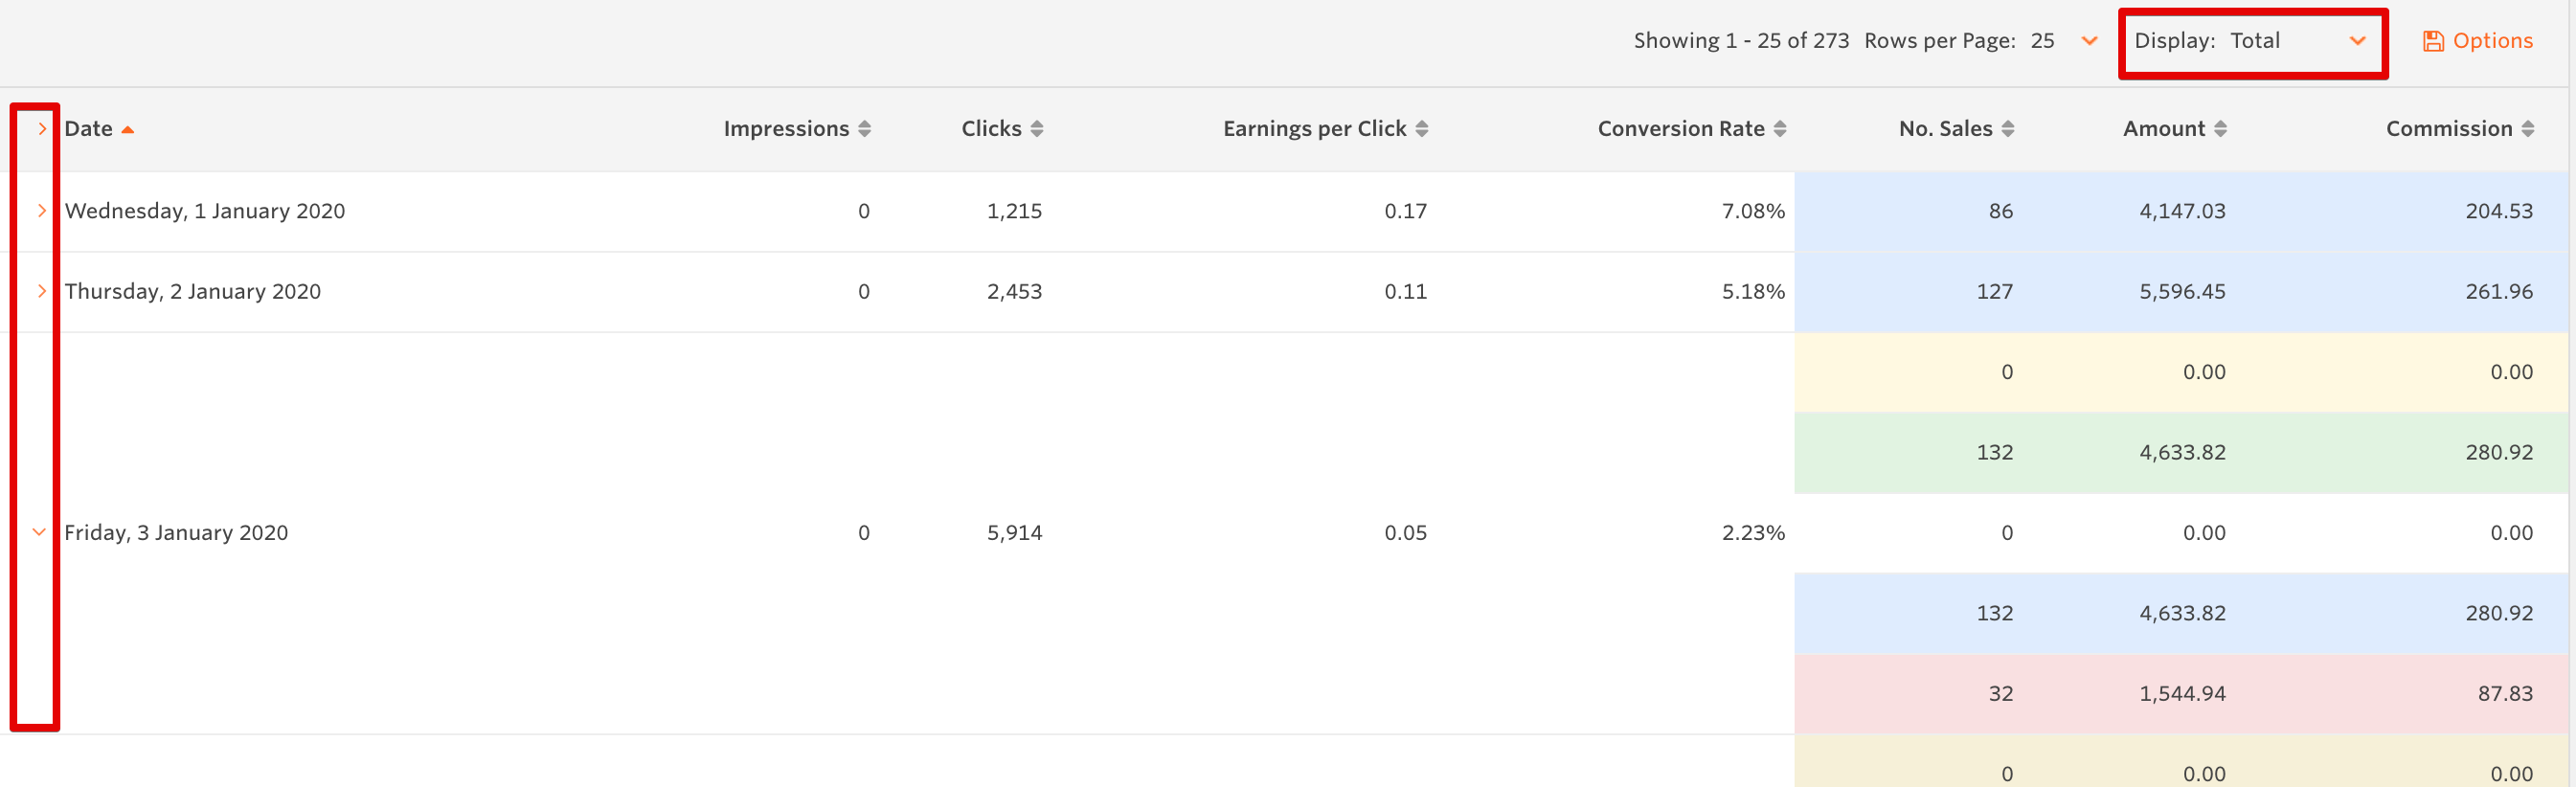
You can export this data as either an Excel or CSV file by hovering over the Options button.
Video explanation of the Performance Over Time
here.
See other Reports in the article:
Where do I find reports?